from toolkit import H
import numpy as np
import pandas as pd
Windows 10
Python 3.8.8 @ MSC v.1928 64 bit (AMD64)
Latest build date 2021.04.18
pandas version:  1.2.2
numpy version:  1.20.1
重塑和数据透视表
pivot
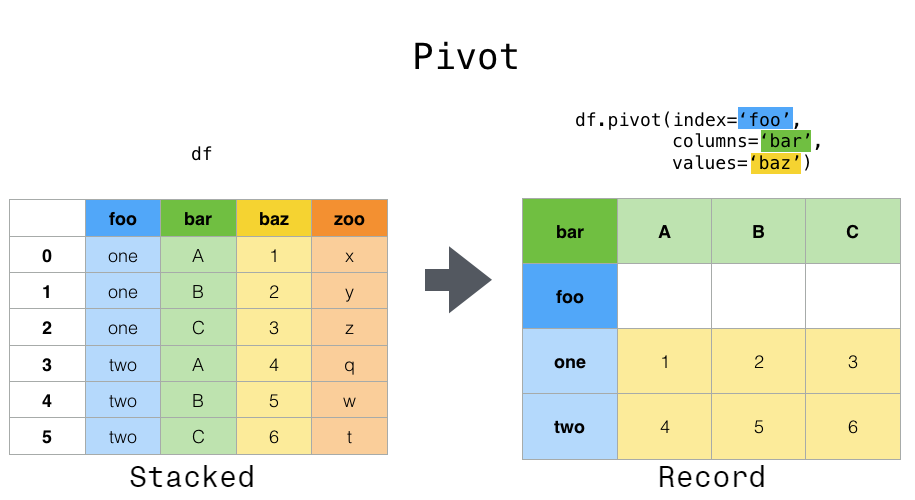
DataFrame.pivot()方法重排数据。它是一个快捷方式,它使用set_index将列数据变成行索引,然后使用unstack将行索引转为列索引。
DataFrame.pivot(self, index=None, columns=None, values=None)
-
index:str. 指定一个column name,对该列数据执行set_index操作(将该列数据变成行索引,并删除原来的行索引)。如果为None,则不执行set_index。 -
columns:str. 指定了哪列数据作为结果的columns labels。
实际上对 index,clumns 指定的列数据均 set_index,然后仅对 columns 对应的列数据 unstack
values:str. 指定了哪列数据作为结果的元素。如果未提供,则剩余的所有列都将作为结果的元素。
创建示例DataFrame:
import pandas.util.testing as tm
# import pandas.testing as tm

tm.N = 3

def unpivot(frame):
    N, K = frame.shape
    data = {'value': frame.to_numpy().ravel('F'),
            'variable': np.asarray(frame.columns).repeat(N),
            'date': np.tile(np.asarray(frame.index), K)}
    return pd.DataFrame(data, columns=['date', 'variable', 'value'])

df = unpivot(tm.makeTimeDataFrame())
df
          date variable     value
0   2000-01-03        A -1.782234
1   2000-01-04        A  0.101391
2   2000-01-05        A  1.419975
3   2000-01-06        A  1.314406
4   2000-01-07        A -0.125151
..         ...      ...       ...
115 2000-02-07        D -0.629166
116 2000-02-08        D -1.680323
117 2000-02-09        D  0.374173
118 2000-02-10        D  0.805691
119 2000-02-11        D  0.176506

[120 rows x 3 columns]
要选择所有variable=A的值,可以这样做:
df[df['variable'] == 'A']
         date variable     value
0  2000-01-03        A -1.782234
1  2000-01-04        A  0.101391
2  2000-01-05        A  1.419975
3  2000-01-06        A  1.314406
4  2000-01-07        A -0.125151
5  2000-01-10        A -0.004296
6  2000-01-11        A  1.032221
7  2000-01-12        A -0.799518
8  2000-01-13        A -1.177311
9  2000-01-14        A  1.328925
10 2000-01-17        A -0.739238
11 2000-01-18        A  0.905413
12 2000-01-19        A  2.075981
13 2000-01-20        A  0.399985
14 2000-01-21        A -0.198506
15 2000-01-24        A -2.124259
16 2000-01-25        A  0.770036
17 2000-01-26        A -0.465471
18 2000-01-27        A  0.775741
19 2000-01-28        A -0.175636
20 2000-01-31        A -1.466900
21 2000-02-01        A  0.791248
22 2000-02-02        A  0.698035
23 2000-02-03        A  0.070490
24 2000-02-04        A -0.035969
25 2000-02-07        A  0.182505
26 2000-02-08        A -0.046646
27 2000-02-09        A  0.791771
28 2000-02-10        A  0.020424
29 2000-02-11        A  0.055036
但是假设我们希望对变量进行时间序列运算,更好的表示方法是列是唯一的变量,行索引作为日期。为了将数据重塑为这种形式,我们使用DataFrame.pivot()方法(也实现为顶级函数pivot()):
df.pivot(index='date', columns='variable', values='value')
variable           A         B         C         D
date
2000-01-03 -1.782234 -0.230027  0.792949  0.946672
2000-01-04  0.101391 -0.301494  0.043205  0.739108
2000-01-05  1.419975 -1.714240  0.416010 -0.236371
2000-01-06  1.314406  1.584313  1.220858 -0.151637
2000-01-07 -0.125151 -0.562998  0.870561 -0.077207
2000-01-10 -0.004296  1.807812  1.180116 -0.470526
2000-01-11  1.032221 -0.500968  0.658132 -0.942816
2000-01-12 -0.799518 -1.109232  2.085041 -0.477622
2000-01-13 -1.177311  1.452246  0.030806 -0.385781
2000-01-14  1.328925  0.527299  1.804724 -0.100643
2000-01-17 -0.739238  0.884090  0.199108  0.296472
2000-01-18  0.905413  0.874131  1.173765  0.151686
2000-01-19  2.075981 -0.929207  1.587471 -0.638356
2000-01-20  0.399985  0.590234  1.565763 -0.364313
2000-01-21 -0.198506  0.034625  0.207252  0.372477
2000-01-24 -2.124259  0.315902  0.405071  0.525225
2000-01-25  0.770036  0.651360 -0.673813 -0.610529
2000-01-26 -0.465471  0.251278  0.351564 -1.552060
2000-01-27  0.775741 -0.287602 -0.784822 -0.553045
2000-01-28 -0.175636  1.729924  0.413734  0.589292
2000-01-31 -1.466900  0.115719  0.684800 -0.193683
2000-02-01  0.791248  0.395742 -0.218322 -0.042245
2000-02-02  0.698035  0.524885 -0.266027  1.120873
2000-02-03  0.070490 -1.879266  1.875913 -0.540630
2000-02-04 -0.035969 -1.353574  0.780084  2.047943
2000-02-07  0.182505  2.131582  0.220263 -0.629166
2000-02-08 -0.046646  2.010064 -0.730357 -1.680323
2000-02-09  0.791771 -0.402250  0.802552  0.374173
2000-02-10  0.020424 -0.323662 -0.925276  0.805691
2000-02-11  0.055036  0.351664 -0.744864  0.176506
如果省略values参数,并且输入DataFrame具有多于一列的值,则结果DataFrame将具有多层次列索引:
df['value2'] = df['value'] * 2
print(df)

pivoted = df.pivot(index='date', columns='variable')
pivoted
          date variable     value    value2
0   2000-01-03        A -1.782234 -3.564468
1   2000-01-04        A  0.101391  0.202782
2   2000-01-05        A  1.419975  2.839951
3   2000-01-06        A  1.314406  2.628813
4   2000-01-07        A -0.125151 -0.250301
..         ...      ...       ...       ...
115 2000-02-07        D -0.629166 -1.258331
116 2000-02-08        D -1.680323 -3.360647
117 2000-02-09        D  0.374173  0.748347
118 2000-02-10        D  0.805691  1.611382
119 2000-02-11        D  0.176506  0.353012

[120 rows x 4 columns]
               value                      ...    value2
variable           A         B         C  ...         B         C         D
date                                      ...
2000-01-03 -1.782234 -0.230027  0.792949  ... -0.460055  1.585898  1.893344
2000-01-04  0.101391 -0.301494  0.043205  ... -0.602988  0.086411  1.478215
2000-01-05  1.419975 -1.714240  0.416010  ... -3.428479  0.832020 -0.472741
2000-01-06  1.314406  1.584313  1.220858  ...  3.168626  2.441716 -0.303274
2000-01-07 -0.125151 -0.562998  0.870561  ... -1.125997  1.741123 -0.154415
2000-01-10 -0.004296  1.807812  1.180116  ...  3.615624  2.360232 -0.941052
2000-01-11  1.032221 -0.500968  0.658132  ... -1.001935  1.316265 -1.885632
2000-01-12 -0.799518 -1.109232  2.085041  ... -2.218464  4.170082 -0.955244
2000-01-13 -1.177311  1.452246  0.030806  ...  2.904491  0.061611 -0.771561
2000-01-14  1.328925  0.527299  1.804724  ...  1.054597  3.609447 -0.201287
2000-01-17 -0.739238  0.884090  0.199108  ...  1.768179  0.398216  0.592945
2000-01-18  0.905413  0.874131  1.173765  ...  1.748262  2.347530  0.303372
2000-01-19  2.075981 -0.929207  1.587471  ... -1.858415  3.174941 -1.276712
2000-01-20  0.399985  0.590234  1.565763  ...  1.180468  3.131526 -0.728627
2000-01-21 -0.198506  0.034625  0.207252  ...  0.069250  0.414504  0.744954
2000-01-24 -2.124259  0.315902  0.405071  ...  0.631803  0.810141  1.050450
2000-01-25  0.770036  0.651360 -0.673813  ...  1.302721 -1.347626 -1.221058
2000-01-26 -0.465471  0.251278  0.351564  ...  0.502556  0.703129 -3.104120
2000-01-27  0.775741 -0.287602 -0.784822  ... -0.575204 -1.569645 -1.106090
2000-01-28 -0.175636  1.729924  0.413734  ...  3.459848  0.827468  1.178585
2000-01-31 -1.466900  0.115719  0.684800  ...  0.231438  1.369600 -0.387366
2000-02-01  0.791248  0.395742 -0.218322  ...  0.791483 -0.436645 -0.084490
2000-02-02  0.698035  0.524885 -0.266027  ...  1.049769 -0.532054  2.241745
2000-02-03  0.070490 -1.879266  1.875913  ... -3.758531  3.751826 -1.081260
2000-02-04 -0.035969 -1.353574  0.780084  ... -2.707148  1.560167  4.095886
2000-02-07  0.182505  2.131582  0.220263  ...  4.263163  0.440526 -1.258331
2000-02-08 -0.046646  2.010064 -0.730357  ...  4.020128 -1.460713 -3.360647
2000-02-09  0.791771 -0.402250  0.802552  ... -0.804499  1.605104  0.748347
2000-02-10  0.020424 -0.323662 -0.925276  ... -0.647325 -1.850551  1.611382
2000-02-11  0.055036  0.351664 -0.744864  ...  0.703327 -1.489728  0.353012

[30 rows x 8 columns]
注意
如果索引包含重复项,pivot()将出错,无法重塑。在这种情况下,请考虑使用pivot_table(),它是pivot的泛化,可以处理一个索引/列对的重复值。
stack: 列索引 $\rightarrow$ 行索引
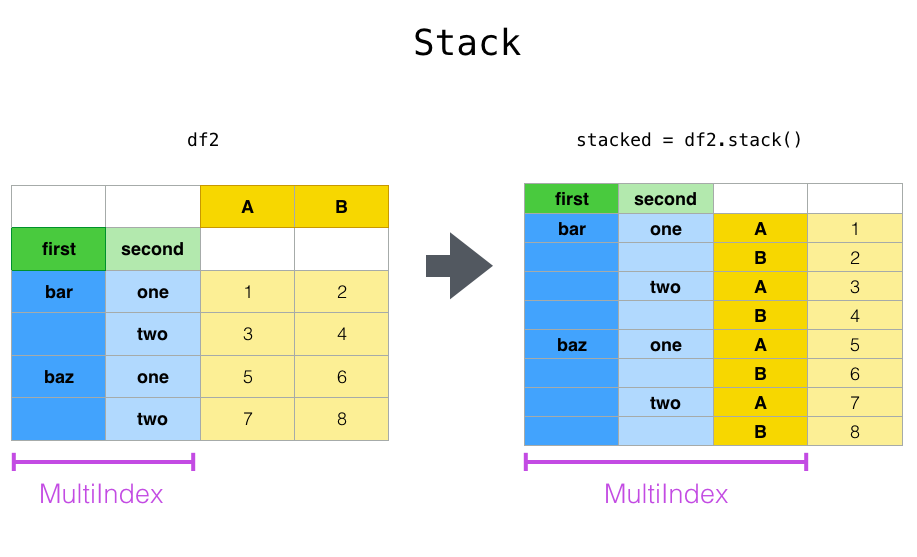
DataFrame.stack方法将数据的列索引旋转为行索引, 新的行索引是多级索引,最内层的行索引就是原来的列索引。注意:它跟转置不同,转置会同时旋转数据。
DataFrame.stack(self, level=-1, dropna=True)
level:int,str,list of int,list of str. 如果列索引为多级索引,它指定了将哪个级别的索引旋转为行索引。dropna:bool. 如果为True,则如果结果中某行全为NaN,则抛弃该行。
最清晰的解释方式是通过示例。先创建一个示例数据:
tuples = list(zip(*[['bar', 'bar', 'baz', 'baz',
                     'foo', 'foo', 'qux', 'qux'],
                    ['one', 'two', 'one', 'two',
                     'one', 'two', 'one', 'two']]))
index = pd.MultiIndex.from_tuples(tuples, names=['first', 'second'])
df = pd.DataFrame(np.random.randn(8, 2), index=index, columns=['A', 'B'])

df2 = df[:4]
df2
                     A         B
first second
bar   one     1.731770 -0.852230
      two     0.268685 -0.266598
baz   one     0.989354 -1.077744
      two     0.408281  0.163966
stacked = df2.stack()
stacked
first  second
bar    one     A    1.731770
               B   -0.852230
       two     A    0.268685
               B   -0.266598
baz    one     A    0.989354
               B   -1.077744
       two     A    0.408281
               B    0.163966
dtype: float64
unstack: 行索引 $\rightarrow$ 列索引
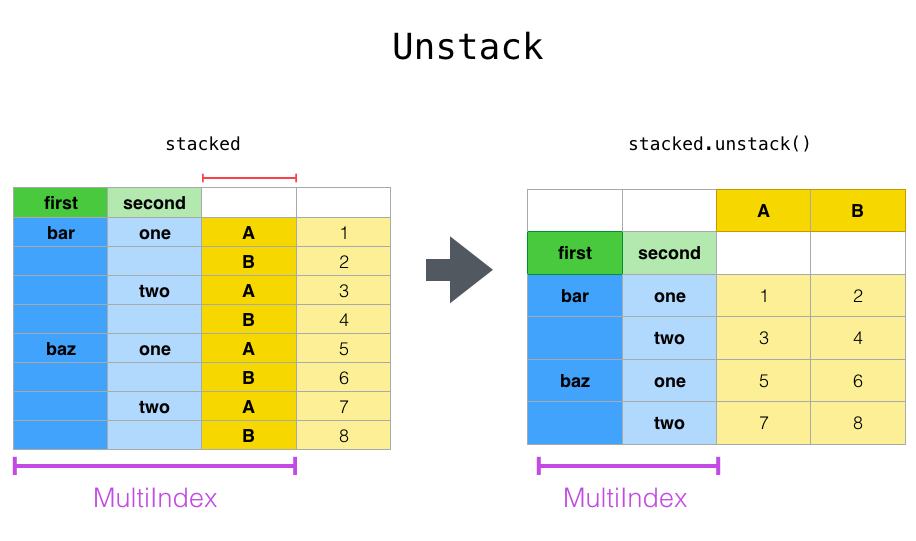
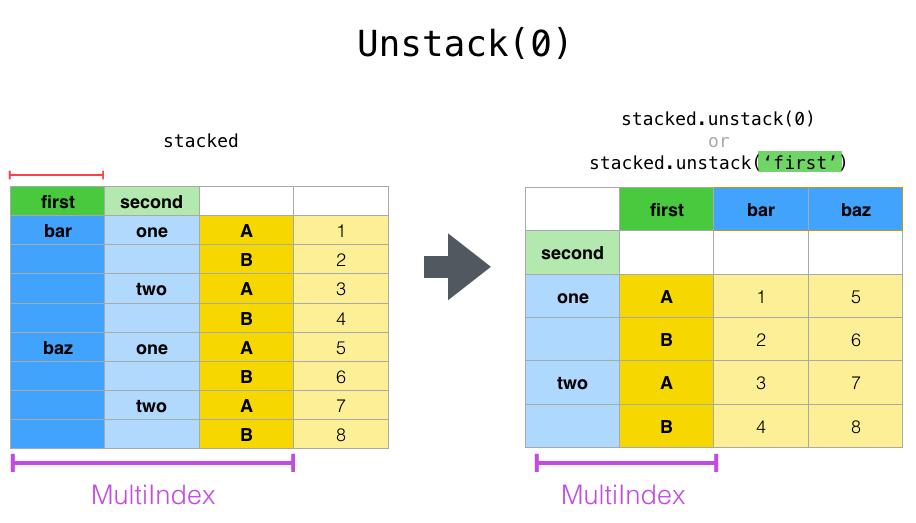
与DataFrame.stack对应的是DataFrame.unstack方法。它将数据的行索引转换为列索引。 注意:它跟转置不同,转置会同时旋转数据。
DataFrame.unstack(self, level=-1, fill_value=None)
level:int,str,list of int,list of str. 如果行索引为多级索引,它指定了将哪个级别的行索引旋转为列索引。fill_value:一个标量。如果结果中有NaN,则使用fill_value替换。
unstack默认情况下将最后一级行索引转换成列索引:
print(stacked)
first  second
bar    one     A    1.731770
               B   -0.852230
       two     A    0.268685
               B   -0.266598
baz    one     A    0.989354
               B   -1.077744
       two     A    0.408281
               B    0.163966
dtype: float64
stacked.unstack()
                     A         B
first second
bar   one     1.731770 -0.852230
      two     0.268685 -0.266598
baz   one     0.989354 -1.077744
      two     0.408281  0.163966
stacked.unstack(1)
second        one       two
first
bar   A  1.731770  0.268685
      B -0.852230 -0.266598
baz   A  0.989354  0.408281
      B -1.077744  0.163966
stacked.unstack(0)
first          bar       baz
second
one    A  1.731770  0.989354
       B -0.852230 -1.077744
two    A  0.268685  0.408281
       B -0.266598  0.163966
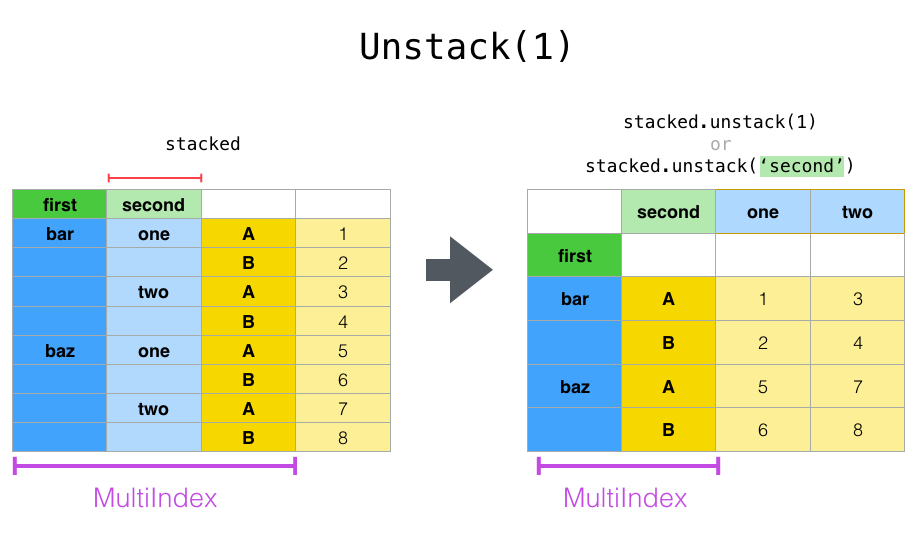
如果索引具有名称,则可以使用级别名称而不是指定级别编号:
stacked.unstack('second')
second        one       two
first
bar   A  1.731770  0.268685
      B -0.852230 -0.266598
baz   A  0.989354  0.408281
      B -1.077744  0.163966
注意,stack和unstack方法会隐式地对索引进行排序:
index = pd.MultiIndex.from_product([[2, 1], ['a', 'b']])

df = pd.DataFrame(np.random.randn(4), index=index, columns=['A'])

print(df, "\n")
print(df.unstack().stack())

all(df.unstack().stack() == df.sort_index())
            A
2 a  2.625688
  b -0.594094
1 a -0.060549
  b  0.364438

            A
1 a -0.060549
  b  0.364438
2 a  2.625688
  b -0.594094
True
多级别索引
可以通过传递list of label来一次性 stack 或 unstack 多个级别的索引。在这种情况下,最终结果就好像列表中的每个级别的索引都是单独处理的:
columns = pd.MultiIndex.from_tuples([
    ('A', 'cat', 'long'), ('B', 'cat', 'long'),
    ('A', 'dog', 'short'), ('B', 'dog', 'short')],
    names=['exp', 'animal', 'hair_length'])

df = pd.DataFrame(np.random.randn(4, 4), columns=columns)
print(df)

df.stack(level=['animal', 'hair_length'])
exp                 A         B         A         B
animal            cat       cat       dog       dog
hair_length      long      long     short     short
0            0.881071 -1.103850 -0.507086  1.147644
1            0.952815 -0.245752 -1.461688  2.184861
2            0.940424  0.688161  0.353364  0.320918
3           -0.958997  2.038420  2.283049 -0.890982
exp                          A         B
  animal hair_length
0 cat    long         0.881071 -1.103850
  dog    short       -0.507086  1.147644
1 cat    long         0.952815 -0.245752
  dog    short       -1.461688  2.184861
2 cat    long         0.940424  0.688161
  dog    short        0.353364  0.320918
3 cat    long        -0.958997  2.038420
  dog    short        2.283049 -0.890982
索引列表可以包含索引名称或索引级别的编号(但不能同时包含两者):
# df.stack(level=['animal', 'hair_length'])
# from above is equivalent to:
df.stack(level=[1, 2])
exp                          A         B
  animal hair_length
0 cat    long         0.881071 -1.103850
  dog    short       -0.507086  1.147644
1 cat    long         0.952815 -0.245752
  dog    short       -1.461688  2.184861
2 cat    long         0.940424  0.688161
  dog    short        0.353364  0.320918
3 cat    long        -0.958997  2.038420
  dog    short        2.283049 -0.890982
缺失数据
这些函数对于处理丢失的数据非常智能,并且不希望层次索引中的每个子组都具有相同的标签集。它们还可以处理未排序的索引(当然,您可以通过调用sort_index对其进行排序)。下面是一个更复杂的例子:
columns = pd.MultiIndex.from_tuples([('A', 'cat'), ('B', 'dog'),
                                     ('B', 'cat'), ('A', 'dog')],
                                    names=['exp', 'animal'])

index = pd.MultiIndex.from_product([('bar', 'baz', 'foo', 'qux'),
                                    ('one', 'two')],
                                   names=['first', 'second'])

df = pd.DataFrame(np.random.randn(8, 4), index=index, columns=columns)

df2 = df.iloc[[0, 1, 2, 4, 5, 7]]
print(df2)
exp                  A         B                   A
animal             cat       dog       cat       dog
first second
bar   one    -0.097444  0.818370  0.515666  2.315783
      two     0.849560  0.814575 -0.296291 -0.095546
baz   one     0.071727 -0.778597 -0.642056  0.307554
foo   one     0.017500  0.925994  0.239425 -0.768354
      two    -0.248389 -0.145917  0.759299 -1.099883
qux   two     0.743433 -0.534109 -0.236758  0.831853
如上所述,stack可以使用level参数来调用以选择要堆叠的列中的级别:
df2.stack('exp')
animal                 cat       dog
first second exp
bar   one    A   -0.097444  2.315783
             B    0.515666  0.818370
      two    A    0.849560 -0.095546
             B   -0.296291  0.814575
baz   one    A    0.071727  0.307554
             B   -0.642056 -0.778597
foo   one    A    0.017500 -0.768354
             B    0.239425  0.925994
      two    A   -0.248389 -1.099883
             B    0.759299 -0.145917
qux   two    A    0.743433  0.831853
             B   -0.236758 -0.534109
df2.stack('animal')
exp                         A         B
first second animal
bar   one    cat    -0.097444  0.515666
             dog     2.315783  0.818370
      two    cat     0.849560 -0.296291
             dog    -0.095546  0.814575
baz   one    cat     0.071727 -0.642056
             dog     0.307554 -0.778597
foo   one    cat     0.017500  0.239425
             dog    -0.768354  0.925994
      two    cat    -0.248389  0.759299
             dog    -1.099883 -0.145917
qux   two    cat     0.743433 -0.236758
             dog     0.831853 -0.534109
如果子组没有相同的标签集,则取消堆叠可能会导致缺少值。默认情况下,缺少的值将替换为该数据类型的默认填充值,NaN表示浮点,NaT表示datetimelike,等等。对于整数类型,默认情况下,数据将转换为浮点,缺少的值将设置为NaN:
df3 = df.iloc[[0, 1, 4, 7], [1, 2]]
print(df3)

df3.unstack()
exp                  B
animal             dog       cat
first second
bar   one     0.818370  0.515666
      two     0.814575 -0.296291
foo   one     0.925994  0.239425
qux   two    -0.534109 -0.236758
exp            B
animal       dog                 cat
second       one       two       one       two
first
bar     0.818370  0.814575  0.515666 -0.296291
foo     0.925994       NaN  0.239425       NaN
qux          NaN -0.534109       NaN -0.236758
或者设置fill_value参数,用于指定缺失数据的值。
df3.unstack(fill_value=-1e9)
exp                B
animal           dog                         cat
second           one           two           one           two
first
bar     8.183697e-01  8.145746e-01  5.156662e-01 -2.962912e-01
foo     9.259943e-01 -1.000000e+09  2.394253e-01 -1.000000e+09
qux    -1.000000e+09 -5.341089e-01 -1.000000e+09 -2.367577e-01
多级索引
当列是多索引时,取消堆栈也会小心地执行正确的操作:
df[:3].unstack(0)
exp            A                   B  ...                   A
animal       cat                 dog  ...       cat       dog
first        bar       baz       bar  ...       baz       bar       baz
second                                ...
one    -0.097444  0.071727  0.818370  ... -0.642056  2.315783  0.307554
two     0.849560       NaN  0.814575  ...       NaN -0.095546       NaN

[2 rows x 8 columns]
df2.unstack(1)
exp            A                   B  ...                   A
animal       cat                 dog  ...       cat       dog
second       one       two       one  ...       two       one       two
first                                 ...
bar    -0.097444  0.849560  0.818370  ... -0.296291  2.315783 -0.095546
baz     0.071727       NaN -0.778597  ...       NaN  0.307554       NaN
foo     0.017500 -0.248389  0.925994  ...  0.759299 -0.768354 -1.099883
qux          NaN  0.743433       NaN  ... -0.236758       NaN  0.831853

[4 rows x 8 columns]
通过Melt重塑
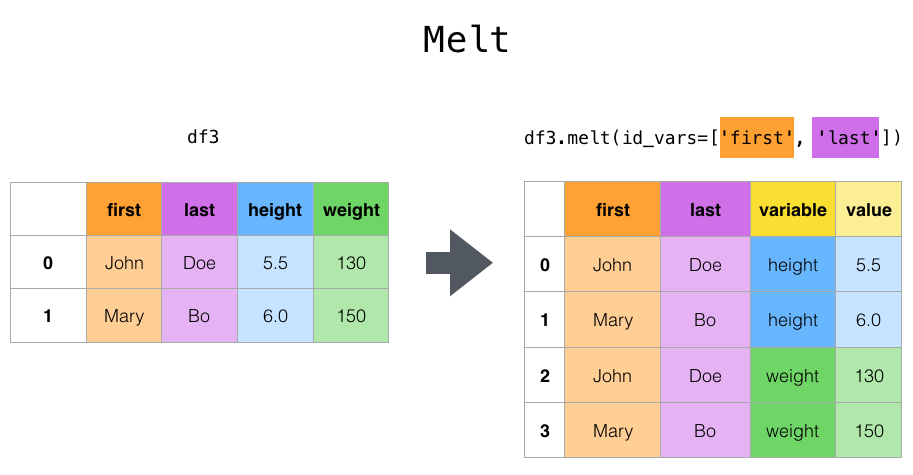
cheese = pd.DataFrame({'first': ['John', 'Mary'],
                        'last': ['Doe', 'Bo'],
                      'height': [5.5, 6.0],
                      'weight': [130, 150]})

print(cheese)
  first last  height  weight
0  John  Doe     5.5     130
1  Mary   Bo     6.0     150
cheese.melt(id_vars=['first', 'last'])
  first last variable  value
0  John  Doe   height    5.5
1  Mary   Bo   height    6.0
2  John  Doe   weight  130.0
3  Mary   Bo   weight  150.0
cheese.melt(id_vars=['first', 'last'], var_name='quantity')
  first last quantity  value
0  John  Doe   height    5.5
1  Mary   Bo   height    6.0
2  John  Doe   weight  130.0
3  Mary   Bo   weight  150.0
另一种转换方法是使用wide_to_long()面板数据便利功能。它不如灵活melt(),但更易于使用。
dft = pd.DataFrame({"A1970": {0: "a", 1: "b", 2: "c"},
                    "A1980": {0: "d", 1: "e", 2: "f"},
                    "B1970": {0: 2.5, 1: 1.2, 2: .7},
                    "B1980": {0: 3.2, 1: 1.3, 2: .1},
                        "X": dict(zip(range(3), np.random.randn(3)))})

dft["id"] = dft.index
print(dft)

pd.wide_to_long(dft, ["A", "B"], i="id", j="year")
  A1970 A1980  B1970  B1980         X  id
0     a     d    2.5    3.2  2.127480   0
1     b     e    1.2    1.3 -0.217594   1
2     c     f    0.7    0.1 -1.218903   2
                X  A    B
id year
0  1970  2.127480  a  2.5
1  1970 -0.217594  b  1.2
2  1970 -1.218903  c  0.7
0  1980  2.127480  d  3.2
1  1980 -0.217594  e  1.3
2  1980 -1.218903  f  0.1